NYU develops a user interface for the Paperscape map

At the start of this year we were contacted by Sinclert Perez and Kyle Cranmer from New York University who informed us about a project they were working on for which they planned to make use of the Paperscape backend. As a part of this project they intended to implement a new front-end interface for the Paperscape map using modern and standardized front-end libraries, and they had some questions regarding the interfacing.

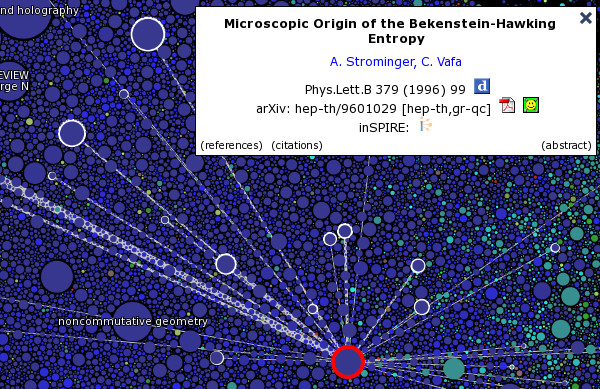
Their front-end UI is now ready and available on Github. It uses the leaflet JS library as a replacement for the custom tiling engine used by the Paperscape map client, as well as modern tools such as React and Semantic. Below is a screenshot of the client in action (see the Github page for animated gifs):

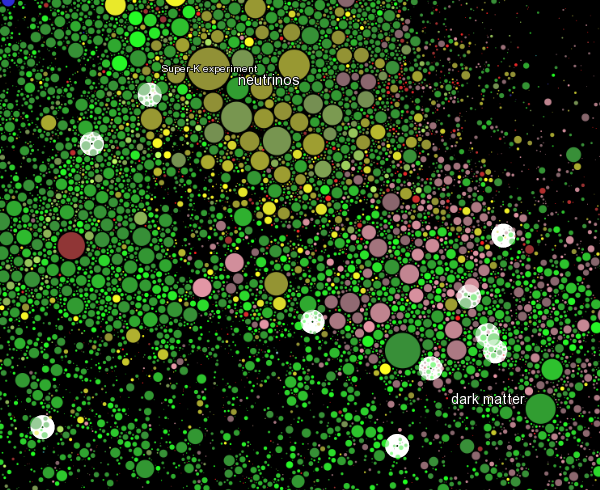
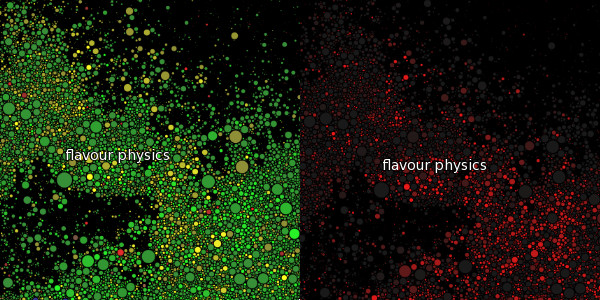
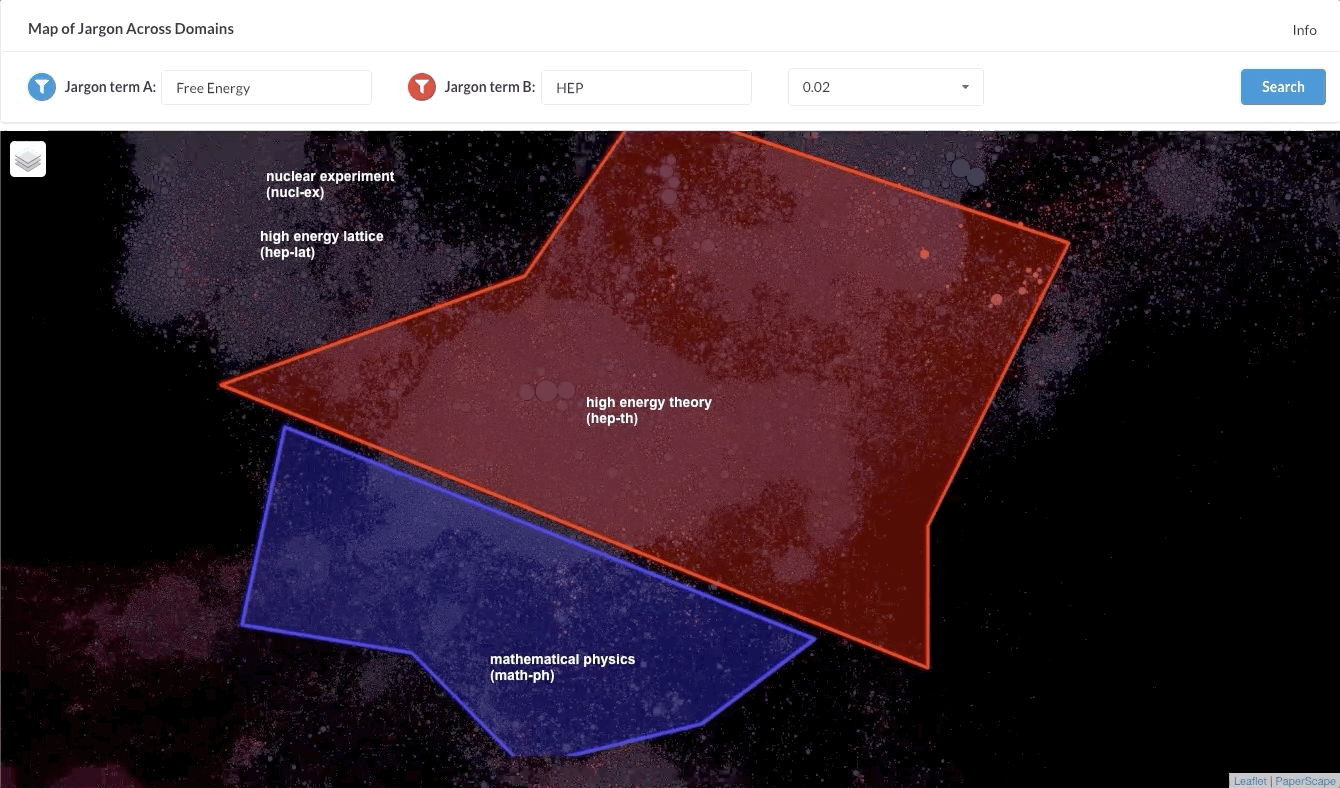
The project the UI was developed for is called the Dialect map, which is still in progress. It aims to add new features to the Paperscape map such as scientific jargon comparison, as illustrated in the screenshot below:

See the NYU Data Science and Services (DS3) page for more information.

Map generation code now open-source

While the source code for the Paperscape browser-based map client was released on Github in early 2015, the back-end code first required a clean up before it could meet a similar fate. The inspiration to finally do so came from a Paperscape-related project we worked on for the Max Planck Digital Library in September this year. As a result, a significant part of the Paperscape back-end is now available on Github under a MIT license. That includes the code for n-body map generation (written in C), map tile generation (written in Go), and the web-server (also in Go).

Recent incremental updates to Paperscape include:

  • update of the Paperscape arXiv graph data from 1991 to the end of 2015,
  • click-to-search authors in the map-client,
  • improved heatmap colour scheme,
  • general UI improvements.

Improved “new papers” search

Since the beginning of the paperscape map it’s been possible to search for daily new papers of a given arXiv category. For example, the search query ?new-papers hep-ph,crosslists searches for new papers in high energy phenomenology and papers cross-listed to this category for the most recent submission day.

What’s new is that we’ve added a popup box (accessible from the “new papers” link next to the search box) that not only makes searching for new papers easier (no need to type a query), but also more powerful! You can now ask for all newly submitted papers occurring within a specific date range, which spans back to 31 previous submission days.

For example, if you’ve haven’t had the time to check the arXiv in the last two weeks, you could ask to see all new papers from the last 10 submission days:

np-searchbox

And then zoom in on your area of interest, the neutrino landscape for example, to quickly see what papers you have missed:

np-search

We’ve also made it easier to select search results: clicking anywhere within the highlighted white halo of a search result paper will select it. To remove the halos, simply “clear” the search result.

In other news, you may have noticed that the map looks slightly different since the beginning of this year. This is because we regenerated it from scratch in order to let some papers that had become stuck (due to the close repulsive force) move  into their natural positions. It’s also worth noting that paperscape now includes the entire author list for all papers, i.e. papers with a very large number of co-authors are now searchable (identified with) each one of these authors.


Quantum Earth

This week we were contacted by Roberto Salazar, who has recently completed a PhD at the University of Concepción in Chile on quantum information. He told us he was inspired by the Paperscape map, and that he had set out to create a personal characterization of the quantum mechanics continent:

The quantum mechanics continent in the Paperscape map

To that end he teamed up with digital designer Sebastián Pizarro , and together they came up with “Quantum Earth”:

mapa-small
“Quantum Earth”, an artist’s impression of the quantum mechanics continent in Paperscape. By Roberto Salazar and Sebastian Pizarro.

It’s a very cool concept, and it would certainly be interesting to see such a map made for the entire Paperscape realm.

Please contact the authors for further details or redistribution rights etc.

Posters

Posters of the Paperscape map are now available for download. Here is a preview (click to see a larger sample):

Poster preview
The newly available Paperscape poster.

The posters are in PDF format and are available in the following sizes (simply click to download):

Please contact us (or leave a comment) if you would prefer a different size, no lay-over text etc.

New feature: view references/citations

It’s now possible to view all the references or citations of a paper that appear in the map. To do so, simply click on the appropriate link at the bottom left of the info box. These links along with the star-like result can be seen in this example screenshot:

View references or citations of a paper in the map.

Note that by references we mean the papers a given paper refers to in its bibliography, and by citations we mean the papers that refer to (cite) it.

The viewing of references/citations is implemented as a search result, so the links in the selected paper’s info box are just shortcuts for the appropriate search. That means you can also search for the references or citations of an arXiv ID directly using ?refs <arXivId> or ?cites <arXivId>, respectively. For example, to search for the references of hep-th/9711200 you could enter the search query: ?refs hep-th/9711200

Introducing the heatmap

Our original colouring scheme for the generated Paperscape map assigns the arXiv categories (mostly) unique colours to easily distinguish them. This colour coding shows clearly how authors cite mostly within their own fields, as well as revealing interesting interfaces between the different categories. For example, check out the fields of dark matter (astrophysics meets high energy phenomenology) and dark energy (high energy theory meets general relativity/quantum cosmology meets astrophysics). However, the cost of using colour to code categories is that other features, such as a paper’s age, must be shown in a different way. Specifically, we use brightness to highlight newer papers in this scheme,  but, due to all the different colours present, new regions of papers don’t really shine through.

Enter our new heatmap, which purely shows the age of papers using a colour gradient from dark gray (old) to bright red (new). The heatmap can be activated using the new drop down menu located at the top left of the map. In this new colouring scheme regions of recent activity stand out much more clearly, and new papers that are growing quickly can be easily identified. If you haven’t yet, go visit the Paperscape map to try it.

Comparison of category and heatmap colour schemes

Now for some details. We found that a linear mapping of the arXiv’s paper ages (spanning 23 years) to the chosen colour gradient wasn’t sufficient to highlight recent activity. After trying various mappings, we’ve opted for a Voigt profile with a sigma of 4 years and a gamma of 1/27 inverse years. These values simply represent what we think best distinguishes what’s currently hot with what’s not. We’ll probably continue to tune the heatmap in the future, and your suggestions are very welcome!

By giving the map two different colour schemes, the question of whether there are other interesting colour schemes naturally arises. It could for example be useful to highlight trending papers i.e. papers that are growing quickly in their number of citations, irrespective of their age. If you have any good ideas please share them!

Searching

Seaching is an important part of Paperscape, since it allows you to find papers on the map. When you enter a search term in the box, all papers that match the search result have a large white halo drawn around them.

At the moment our search can handle arXiv identifiers (eg 1207.7214, hep-ex/9807003), author names (eg E.Witten), titles, keywords (the most common words in the title and abstract of a paper), and new papers (those that appeared on the arXiv today, eg ?n hep-th).

If you type in a list of words in the search box, we do a “boolean and” search for all those words using the authors and keywords of each paper. This gives decent results in a lot of the common cases. For example, searching for "witten qcd" finds papers written by Witten that are about QCD, and also finds papers written about QCD that mention Witten in the abstract.

It is not at the moment possible to construct your own boolean search phrases. For example "?au witten ?ti qcd" does not work, at least not yet!

We are still developing search. If you have any suggestions for how searching should work, please leave a comment.

Some teething issues

Paperscape has been getting quite a bit of traffic in the past 12 hours. Thanks for your interest!

With all the traffic, we have encountered one mild bug. When you click on a paper your browser sends the location of the click to our servers, which then return the associated paper id, if one exists at that location. On rare occasions it is possible to request a paper at a (NaN,NaN) location (yes, I know, that’s strange!), and this was causing issues with our server looking for that location. Consequently, search and clicking on papers was down for a few hours.

It should be fixed now. Please, let us know if you run into any problems.

Labelling regions of the map

The labels on the map are generated mostly automatically. When zoomed out, arXiv categories are displayed, and the position of the category label is computed as the average of all papers in that category. As you zoom in, these category labels disappear, and are replaced by individual labels on top of each paper, so long as that paper is “big enough” on screen. The labels for each paper are determined by analysing the title and abstract, looking for common keywords.

We have now added a third layer to this labelling process: we identify by eye regions of the map that have a definite theme, and give these regions a generic, but not too generic, label. For example, we can identify cleary the “neutrino” area in the north, and the “inflation” area at the interface of hep-th and astro-ph.

These new labels make the transition from arXiv category to keyword labels a bit easier to follow, and also allows you to more easily understand where you are on the map.

In the future we plan to implement a more sophisticated way of labelling that transits smoothly between zoom level, much like in a map of the geographic world. If you have any suggestions for this, please leave us a comment.